
We’re excited to share Model Explorer - a powerful graph visualization tool. Whether you’re developing your own model, converting a model between formats, optimizing for a specific device, or debugging performance and quality, the ability to visualize model architecture and how data flows between nodes can be very useful. With an intuitive, hierarchical visualization of even the largest graphs, Model Explorer enables developers to overcome the complexities of working with large models, particularly when optimizing for edge devices.
This is the third blog post in our series covering Google AI Edge developer releases: the first two posts introduced AI Edge Torch and the Generative API that enable PyTorch models and high performance LLMs on-device.
Developed originally as a utility for Google researchers and engineers, Model Explorer is now publicly available as part of our Google AI Edge family of products. The initial version of Model Explorer offers the following:
In this blog post we’ll walk through how to get started with Model Explorer and a couple powerful use-cases. Further documentation and examples are available here.
Model Explorer’s easy-to-install PyPI package runs locally on your device, in Colab, or in a Python file.
$ pip install ai-edge-model-explorer
$ model-explorer

Starting Model Explorer server at http://localhost:8080These commands will start a server at localhost:8080 and open the Model Explorer web app in a browser tab. Read more about Model Explorer command line usage in the command line guide.
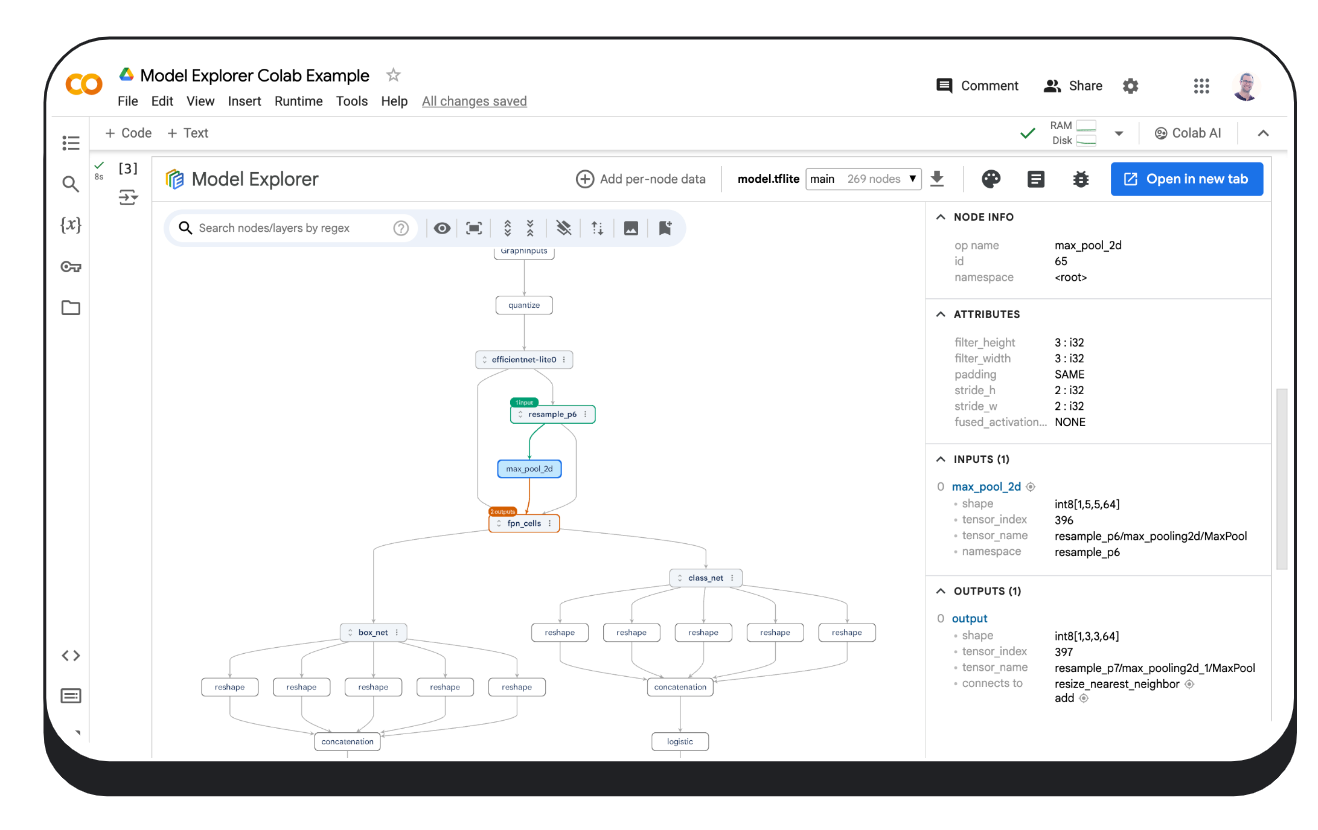
Once you have the localhost server running, upload your model file from your computer (formats supported include those used by JAX, PyTorch, TensorFlow and TensorFlow Lite) and, if needed, select the best adapter for your model via the ‘Adapter’ drop down menu. Click here to learn how to utilize the Model Explorer adapter extension system to visualize unsupported model formats.
# Download a model (this example uses an Efficientdet TFLite model)
import os
import tempfile
import urllib.request

tmp_path = tempfile.mkdtemp()
model_path = os.path.join(tmp_path, 'model.tflite')
urllib.request.urlretrieve("https://storage.googleapis.com/tfweb/model-graph-vis-v2-test-models/efficientdet.tflite", model_path)

# Install Model Explorer
pip install ai-edge-model-explorer

# Visualize the downloaded EfficientDet model
import model_explorer
model_explorer.visualize(model_path)After running the cell, Model Explorer will be displayed in an iFrame embedded in a new cell. In Chrome, the UI will also show an "Open in new tab" button that you can click to show the UI in a separate tab. Visit here to learn more about running Model Explorer in Colab.
The model_explorer package provides convenient APIs to let you visualize models from files or from a PyTorch module and a lower level API to visualize models from multiple sources. Make sure to install it first by following the installation guide. Check out the Model Explorer API guide to learn more.
Below is an example of how to visualize a PyTorch model. Visualizing PyTorch models requires a slightly different approach to other formats, because PyTorch does not have a standard serialization format. Model Explorer offers a specialized API to visualize PyTorch models directly, using the ExportedProgram from torch.export.export.
import model_explorer
import torch
import torchvision

# Prepare a PyTorch model and its inputs
model = torchvision.models.mobilenet_v2().eval()
inputs = (torch.rand([1, 3, 224, 224]),)
ep = torch.export.export(model, inputs)

# Visualize
model_explorer.visualize_pytorch('mobilenet', exported_program=ep)No matter which way you visualize your models, under the hood Model Explorer implements GPU-accelerated graph rendering with WebGL and three.js that achieves a smooth, 60 FPS visualization experience even with graphs containing tens of thousands of nodes. If you’re interested in learning more about how Model Explorer renders large graphs, you can read about it on the Google Research blog.
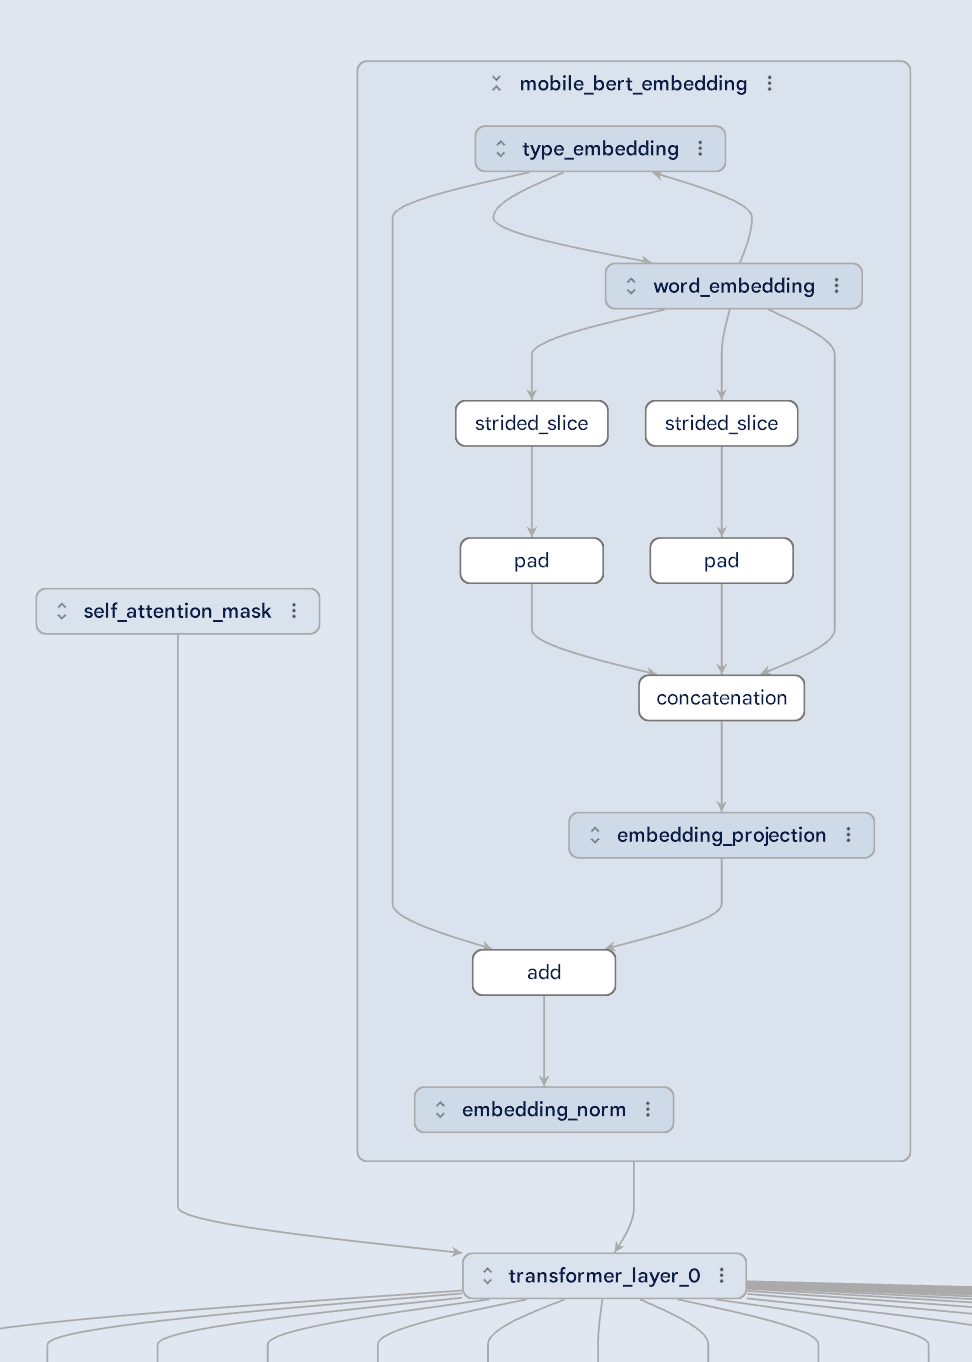
Large models can be complex, but Model Explorer makes them easier to understand by breaking the visualization down into hierarchical layers. Take a look at the MobileBert model pictured below: it's clear how the self-attention mask and the embedding are fed into a transformer layer. You can even dive deeper into the embedding layer to understand the relationships between different types of embeddings. Model Explorer's hierarchical view makes even the most intricate model architectures easier to understand.
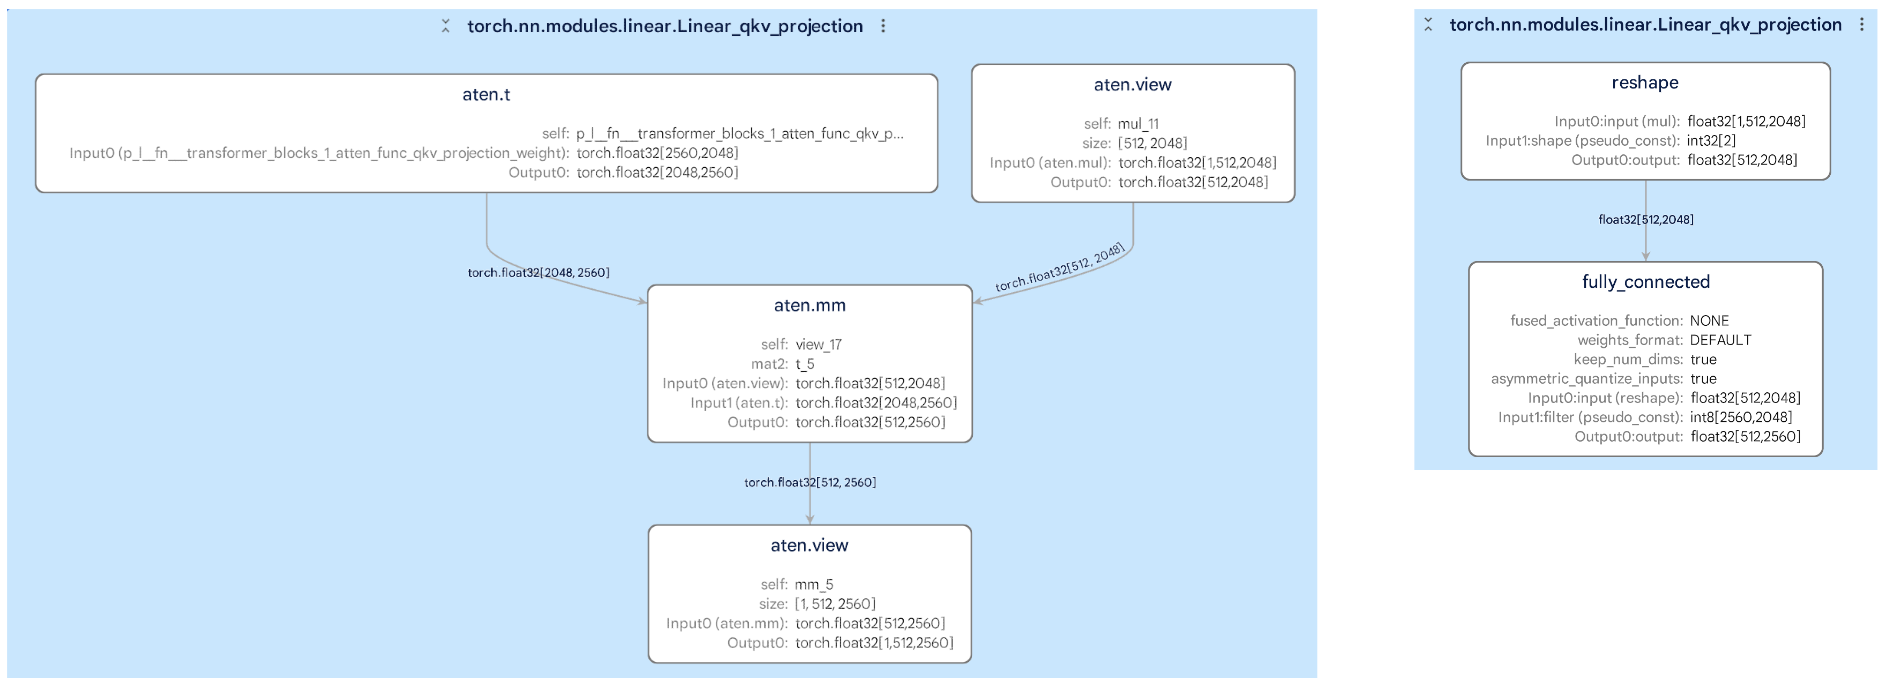
Converting models from one format to another (like PyTorch to TFLite) can be tricky, but Model Explorer helps you compare the original and converted graphs side-by-side. This makes it simple to spot any changes that might affect your model's performance. For example, in the images below, you can see how a subgraph within a layer has changed during conversion, helping you identify and fix potential errors.
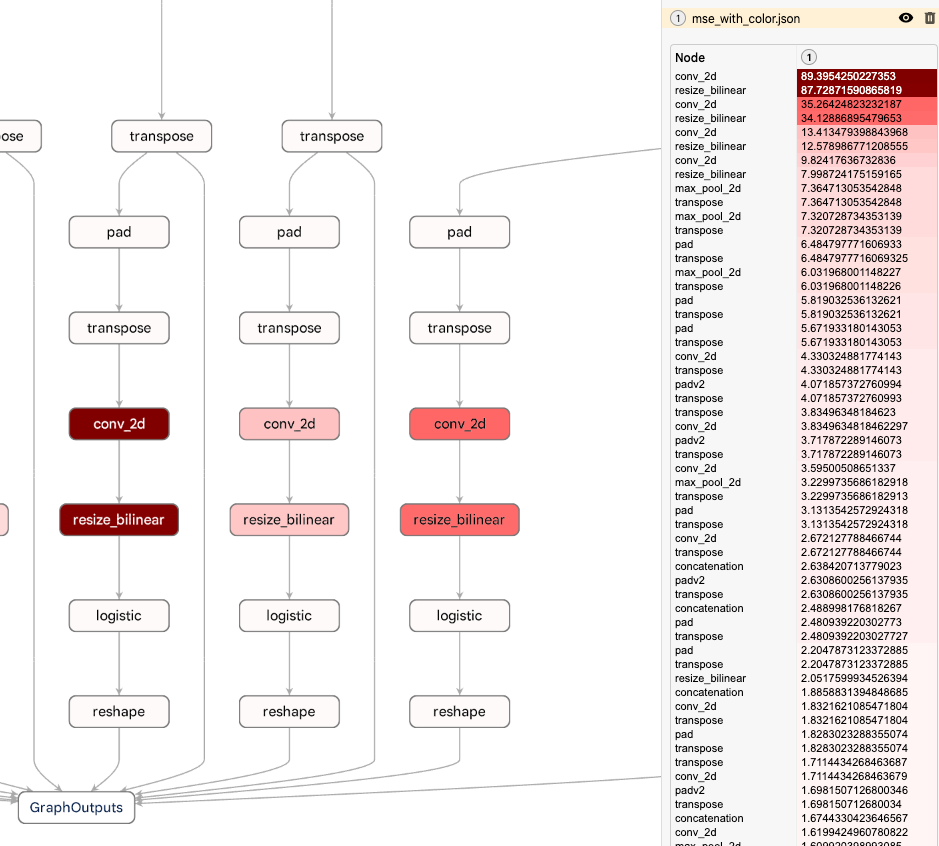
A powerful Model Explorer feature is its ability to overlay per-node data on a graph, allowing you to sort, search, and stylize nodes using the values in that data. Combined with Model Explorer’s hierarchical view system, this feature enables you to quickly spot performance or numeric bottlenecks. The example below shows the mean squared error at each node between a quantized TFLite model and its floating point counterpart. Model Explorer highlights that the quality drop is near the bottom of the graph, giving you the information you need to adjust your quantization method. To learn more about working with custom data in Model Explorer check out our detailed documentation on Github.
Among Model Explorer’s most prominent users at Google are Waymo and Google Silicon. Model Explorer played a crucial role in helping these teams debug and optimize on-device models like Gemini Nano.

We see this as just the beginning. In the coming months, we’re focusing on enhancing the core by refining key UI features like graph diffing and editing, and improving extensibility by allowing you to integrate your own tools into Model Explorer.
This work is a collaboration across multiple functional teams at Google. We would like to extend our thanks to engineers Na Li, Jing Jin, Eric (Yijie) Yang, Akshat Sharma, Chi Zeng, Jacques Pienaar, Chun-nien Chan, Jun Jiang, Matthew Soulanille, Arian Arfaian, Majid Dadashi, Renjie Wu, Zichuan Wei, Advait Jain, Ram Iyengar, Matthias Grundmann, Cormac Brick, Ruofei Du, our Technical Program Manager, Kristen Wright, and our Product Manager, Aaron Karp. We would also like to thank the UX team including Zi Yuan, Anila Alexander, Elaine Thai, Joe Moran and Amber Heinbockel.

Bringing Gemma 4 12B to your Laptop: Unlocking Local, Agentic Workflows with Google AI Edge

How the community trained Gemma to "Think" with Tunix and TPUs
LiteRT: Maximum performance, simplified

Supercharge your integration workflow with the Google Pay & Wallet Developer MCP server

On-device small language models with multimodality, RAG, and Function Calling

Google Tensor SDK Beta with LiteRT