

As developers, we’re used to working with images. We build apps that recognize pets, categorize products, and generate art. But most of the time, we’re living in an RGB world—Red, Green, and Blue. It’s how our eyes and cameras see.
But what if you could give your application superhuman vision? What if it could see in wavelengths invisible to the human eye to understand the world in a fundamentally new way?
That’s the power of multi-spectral imagery, and thanks to the native multimodal capabilities of Google's Gemini models, it is more accessible than ever. You don't need a custom-trained, specialized model anymore. You can start analyzing complex satellite data, right out of the box.
Think of a standard digital photo. Each pixel has three values: R, G, and B. A multi-spectral sensor is like a super-powered camera. Instead of just three bands, it captures data across many different bands of the electromagnetic spectrum, including those we can't see, like Near-Infrared (NIR) and Short-Wave Infrared (SWIR).
Historically, using this data required specialized tools, complex data processing pipelines, and custom machine learning models. Gemini changes the game by letting you leverage its powerful reasoning engine on this rich data with a surprisingly simple technique, as described in our research paper.
Gemini, like other large multimodal models, is pre-trained on a vast dataset of images and text. It understands what a "red car" or "green forest" is. The key to making it understand multi-spectral data is to map the invisible bands we care about into the R, G, and B channels that Gemini already understands.
We create a "false-color composite" image. We're not trying to make it look natural; we're encoding scientific data into a format the model can process.
Here’s the simple, three-step process:
2. Normalize and Map: Scale the data from each band to a standard 0-255 integer range and assign them to the Red, Green, and Blue channels of a new image.
3. Prompt with Context: Pass this newly created image to Gemini and, critically, tell it in the prompt what the colors represent.
This last step is the magic. You are essentially teaching the model, in real-time, how to interpret your custom new images.
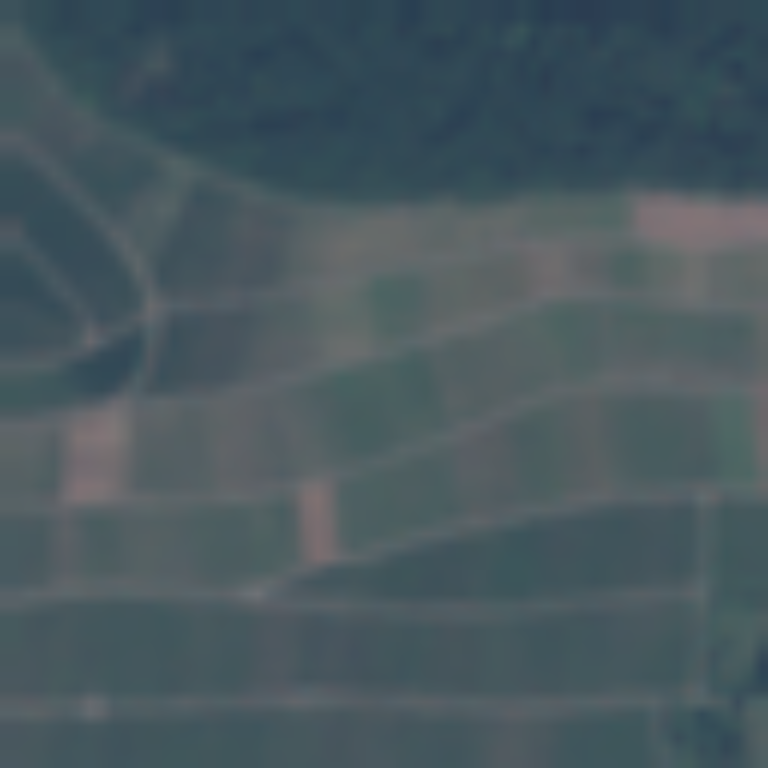
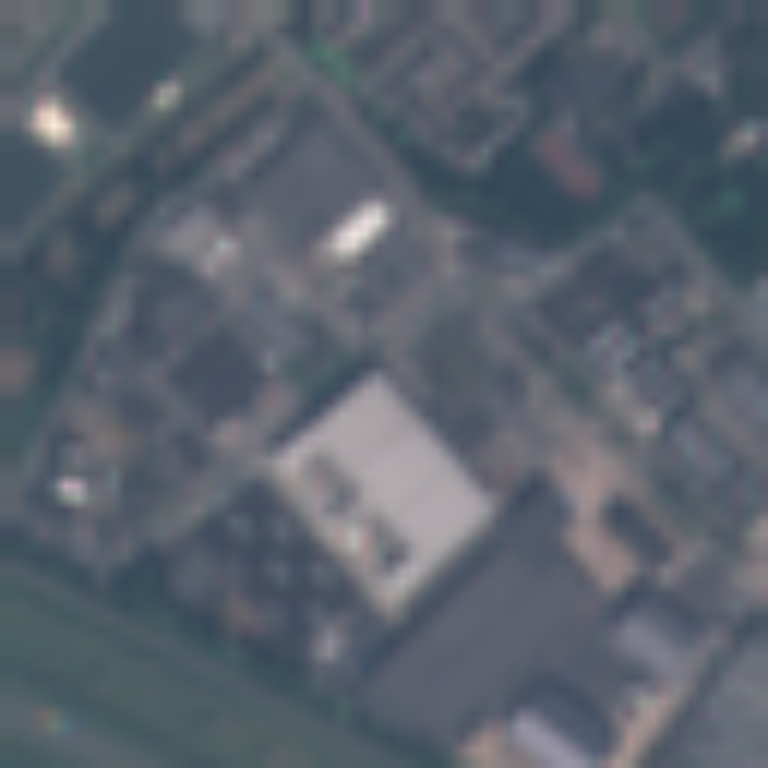
Gemini 2.5 is quite versatile and already works very well for remote sensing. For example, it successfully understands the images below, here from the EuroSat dataset for land cover classification, classifying them accurately as Permanent crop, River and Industrial areas, respectively.

In some challenging scenarios, though, the model might not have enough information from the RGB image alone. For example, this is an image of a River, which initially, the model misclassifies as a Forest.

After introducing and constructing multi-spectral pseudo-images, shown below, and a detailed prompt, as described in the paper, Gemini 2.5 correctly recognizes it as a River, and its reasoning trace shows that the model has utilized the multi-spectral inputs, particularly the NDWI image, to infer this is water.

In another example, shown below, which is an image of a Forest, the model initially classifies it as a Sea Lake, basing its reasoning on the blue/green areas.

When including the multi-spectral inputs, we see the model now easily classifies this as a Forest and the reasoning trace shows that it leverages the additional inputs quite significantly.

As seen from these examples, it is clear that the additional multi-spectral inputs are important for making better decisions. Furthermore, since the model does not need to be changed, we can add other types of inputs in the same way.
We have prepared a colab notebook as an example of how to use Gemini 2.5 with new multi-spectral inputs. You can now try your own remote sensing explorations with Gemini 2.5.
This approach is a game-changer for developers, dramatically lowering the barrier to entry for analyzing complex satellite data. It enables the rapid prototyping of new applications in hours, not weeks, without requiring deep expertise in remote sensing. Thanks to Gemini's powerful in-context learning, developers can dynamically instruct the model on how to interpret different spectral data for various tasks—from agricultural monitoring to urban planning—simply by providing a clear prompt alongside the custom image.
The era of AI-powered environmental monitoring, precision agriculture, and disaster response is here, and with Gemini, the tools are directly in your hands. So grab some public satellite data from sources like NASA's Earthdata, Copernicus Open Access Hub, or Google Earth Engine, and start teaching your app to see the world in a whole new light.
This research is conducted by Ganesh Mallya, Yotam Gigi, Dahun Kim, Maxim Neumann, Genady Beryozkin, Tomer Shekel and Anelia Angelova and we thank all the authors and collaborators. We would also like to thank Nikita Namjoshi, Lauren Usui, Omar Sanseviero, Logan Kilpatrick, Rohan Doshi, Amanda Stanton, Abhijit Ogale, Radu Soricut, Jean-Baptiste Alayrac, AJ Piergiovanni, Justin Burr, Brian Gabriel, Jane Park, Marlo Colinas Vaughan, Vishal Dharmadhikari, Claire Cui, Zoubin Ghahramani for their help and support.

Building High-Performance Data Pipelines with Grain and ArrayRecord

Architecting efficient context-aware multi-agent framework for production
Announcing the Data Commons Gemini CLI extension

Beyond backpropagation: JAX's symbolic power unlocks new frontiers in scientific computing