Google Visualization API Library now available for Google Web Toolkit
By Uwe
Maurer, Google EngineerWe're happy to announce the
Google Visualization API Library
for
Google
Web Toolkit (GWT). This has been a requested addition to GWT for some time now on
the developer forum and we are excited to make it available.
You can
now utilize the visualization and reporting capabilities of the
Google Visualization API while writing native Java code for your GWT
applications and enjoy the best of both worlds. The library includes wrappers for many of
Google's visualizations, such as
Bar Chart,
Annotated Time Line,
Map,
Motion Chart,
Organizational Chart and many others. We have marked
all the visualizations that are currently supported by this library in the
Visualization Gallery.
The
library also includes classes that enable you to easily wrap any existing Visualization
API-compliant visualization in GWT so that you can access it from Java complied by the GWT
compiler. So if you want to wrap your own visualization or the nifty
Piles of Money visualization, you can easily do so.
Lastly, the library includes a class that makes it easy to write new visualizations in
GWT-compiled Java and make it available as JS for general use in the Visualization API. This
is cool if you've been itching to contribute new visualizations but prefer coding in
Java.
Here is example code that draws the well known Annotated Time
Line chart in Java using the new Visualization API Library:
UPDATE:
Changed the code font size to fit on one line so you can copy & paste
package com.blogpost.client;

import com.google.gwt.core.client.EntryPoint;
import
      com.google.gwt.user.client.Window;
import
      com.google.gwt.user.client.ui.RootPanel;
import
      com.google.gwt.visualization.client.AjaxLoader;
import
      com.google.gwt.visualization.client.DataTable;
import
      com.google.gwt.visualization.client.Query;
import
      com.google.gwt.visualization.client.QueryResponse;
import
      com.google.gwt.visualization.client.Query.Callback;
import
      com.google.gwt.visualization.client.visualizations.AnnotatedTimeLine;


public class BlogPost implements EntryPoint {
 public void
      onModuleLoad() {
 AjaxLoader.loadVisualizationApi(new Runnable(){

      public void run() {
 Query query =

      Query.create("http://spreadsheets.google.com/pub?key=pCQbetd-CptH5QNY89vLtAg");

      query.send(new Callback(){

 public void onResponse(QueryResponse
      response) {
 if (response.isError()) {
 Window.alert("An error occured:
      " + response.getDetailedMessage());
 }

 DataTable data =
      response.getDataTable();
 AnnotatedTimeLine.Options options =
      AnnotatedTimeLine.Options.create();
 options.setDisplayAnnotations(true);
 RootPanel.get().add(new AnnotatedTimeLine(data, options, "800px", "400px"));

      }
 });
 }}, AnnotatedTimeLine.PACKAGE);
 }
}
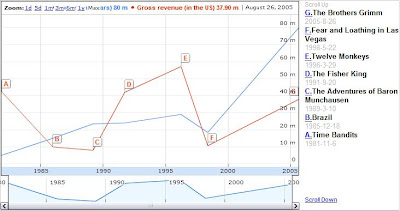
This code draws the same visualization that can be seen in the
example for Annotated Time Line in the
Visualization Gadget Gallery. Both get their
data from Google Spreadsheets, only this code does so in Java instead of Javascript or as a
Gadget.
Enjoy!

