Visualizing Your Cloud’s Data
This post is part of the Who's @ Google I/O, a series of blog posts that give a
closer look at developers who'll be speaking or demoing at Google I/O. Today's post is a
guest post written by Jesse Lorenz from Salesforce.com.Many
companies are storing their data in the cloud, and they are looking for ways to gain insight
to this data. The
Google
Visualization API is a great way to do just that, which is why salesforce.com has
built a set of
Google
Visualization components for
Force.com. These components enable Force.com
customers and partners to quickly embed sophisticated reporting and analysis functionality in
to their Force.com applications. You can even use the
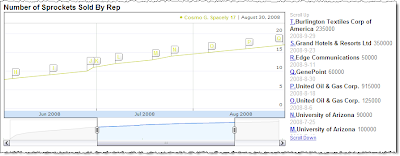
Annotated
Time Line visualization to visualize your sales progress:
The
Google Visualization component project is one of the most popular projects on
developer.force.com/codeshare.
Force.com partners have already begun to leverage the components to build new business
intelligence apps so that Force.com users can quickly generate reports and dashboards that
provide them with new insight to their data.
If you’d like to learn
more about embedding Google Visualizations into your Force.com applications, this
tutorial is
the best place to start. It contains a walk-through of how to get started as well as links to
sample code for all of the supported components. The project is open source and everyone is
encouraged to contribute!
Salesforce.com will be co-presenting a
session at
Google I/O that will
discuss how to embed the power of the Google Visualization API in Force.com business
applications, and how to turn a Force.com application in to a Google Visualization data
source. We hope to see you there! To learn more about developing applications on Force.com, go
to
developer.force.com.
Guest By Jesse
Lorenz from Salesforce.com.

